← Back to Cadence Analytics

URARTU / DEMO FIELD GUIDE

Cadence Analytics
Elements & details.

A landing page for enterprise software: one argument from the top of the page to the bottom, set entirely in Inter on a near-black ground lit in violet. A centred claim with the product screen under it, the names that run it in production directly under, pricing in three tiers, a table against the incumbent, four steps to first value and the questions a procurement team asks. No catalogue — this demo sells one thing.

Explore the building blocks in this demo’s own colours, typography and layout. The header, footer and content use this website’s current settings.

Explore the complete demo ↗

01 / FOUNDATIONS

Typography & rhythm.

Native heading, paragraph, link, list and quotation styles.

A clear point of view.

Details that belong together.

Made for the whole page.

A useful page starts with a clear hierarchy. Strong emphasis, a quieter accent and a meaningful link all have their place.

Good design makes the next step easier to understand.

Illustrative quotation
  • Consistent spacing
  • Readable content
  • Responsive compositions

02 / ACTIONS

Every action has a place.

Try the loading state. These controls do not add products or send requests.

Secondary actionText action

03 / INPUT

Fields with a purpose.

Interactive preview only. Nothing entered here is sent or stored.

Choose an option

04 / FEEDBACK

Clear at every step.

Success message — your selection is ready.
Information message — review the details before continuing.
  • Error message — check the required fields.
How do these examples relate to this demo?

They use the installed theme and Core styles. Each element can be reused and its content edited for a real page.

Illustrative comparison
DetailThis demoYour website
ContentExample words and imageryYour own story
AppearanceCurrent demo settingsEditable theme settings

05 / MEDIA

Images in context.

Images from this demo’s own media library.

woocommerce-placeholder
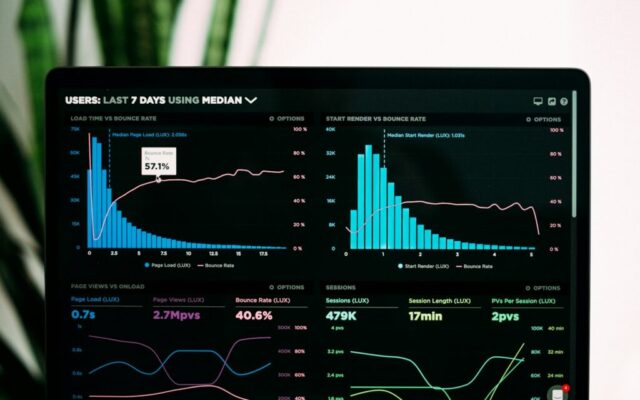
An analytics board on a laptop screen: load time, bounce rate and sessions charted

STORE COMPONENTS

The complete shopping journey.

Real product cards from this demo. Open the store pages to explore filters, product galleries, variations, cart, checkout and account states in their full context.

06 / CUSTOM ELEMENTS

Explore the Core library.

Real registered elements, rendered against this installation’s content. Missing dependencies or matching data are identified beside the example. Forms are preview-only on this page.

WooCommerce Categories

Content element

Select categories to display

Portfolio Widget

Content element

No portfolio items found.

Sortable Products

Commerce element

Sortable Products

No products found.

Product in Image

Commerce element

Reviews

Content element

We had a warehouse and four dashboards nobody trusted, because nobody could see how any figure was produced. The "show me the query" link ended that argument in a week.

Ilse Bergkamp
Head of Data, Alto Freight

Contact Form

Content element

    Social Share

    Content element

    WooCommerce Categories (simple)

    Commerce element

    Product Categories Carousel

    Commerce element

    Brands Carousel

    Commerce element

    Hero

    Content element

    Event analytics

    Answers before you have finished asking

    Cadence reads your events as they happen and answers in under a second — on your own data, in your own region, with the query it ran printed underneath.

    Considered details

    A second thing worth saying

    Illustrative content for this element. Replace the words and images to suit your project.
    A clear structure

    A second thing worth saying

    Illustrative content for this element. Replace the words and images to suit your project.

    Room to make it yours

    A second thing worth saying

    Illustrative content for this element. Replace the words and images to suit your project.

    Feature Row

    Content element
    • Answers while you are still asking Events land in the store in under two seconds and queries return in under one. There is no nightly build, so the dashboard you open at 09:00 includes what happened at 08:59.
    • Shows the query it ran Every chart has a "how was this made" link that prints the exact SQL behind it. An analyst can copy it, change it, and save the result as a new chart without leaving the page.
    • Stays in one region Your account is pinned to Frankfurt, Dublin or Virginia and nothing leaves it — not backups, not logs, not the copy our support team reads when you open a ticket.

    Journal

    Content element

    This element is available, but this demo has no matching content to display yet.

    Pricing

    Content element

    Priced on events, not on seats

    Everybody in your company can read a board on every tier. Charging per seat makes people share logins, which is a security problem sold as a pricing model.

    Starter

    One product, one region, one team.

    €290 /month

    Ask about a trial
    • Up to 20 million events a month
    • Unlimited people
    • Unlimited boards
    • Thirteen months of history
    • Email support, answered in four hours

    Estate

    Volumes where the invoice deserves a conversation.

    Let us talk

    Discuss a deployment
    • Everything in Company
    • Private deployment in your own account
    • A named engineer
    • Contractual availability with automatic credits
    • Security review with your team, not a questionnaire

    Comparison Table

    Content element

    Against a warehouse-and-BI stack

    The arrangement most teams already have, and where it costs them.

    What you are comparing Cadence Warehouse plus a BI tool
    Time from event to chart Under two seconds One to twenty-four hours
    Time to the first useful board Hours Weeks, once the pipeline is built
    Query behind a chart is visible
    Needs a pipeline to maintain
    Cost of one more dashboard Nothing A seat, or an analyst's week
    Data leaves your region Depends on the vendor

    Steps

    Content element

    Four steps to the first chart

    Measured on the last two hundred accounts: half were reading their own data inside a working day.

    1. Point it at your data

      Postgres, BigQuery, Snowflake, S3 or an HTTP endpoint. Read-only credentials, and we tell you exactly which tables we touched.

    2. Name your events

      Map the columns you already have onto the four fields Cadence needs. No new tracking code and no schema migration.

    3. Open a board

      Start from one of eleven boards built for common questions, or from an empty one. Both are editable by anyone who can read a chart.

    4. Put it somewhere useful

      Send a board to Slack on a schedule, alert on a threshold, or expose it as an endpoint your own service reads.

    FAQ

    Content element

    The questions we are asked before every signature

    If yours is not here, write to us and it will be by next week.

    How long does moving off our current tool actually take?

    Reading your data takes an afternoon. Rebuilding the boards people rely on takes as long as there are boards — most teams find they rebuild a third of them and quietly retire the rest. We will do the first five with you on a call, and we do not charge for that.

    Where does our data live, and who can read it?

    In the region you pick, and nowhere else. Our staff have no standing access to it; access is granted per incident, expires after four hours, and is written to the same audit log you can export. The security page has the detail your compliance team will ask for.

    Can we run it inside our own cloud account?

    On the Estate tier, yes — in your account, in your VPC, with us holding no keys. It is the same build, and it updates on the schedule you choose rather than ours.

    What happens if we go over the event allowance?

    Nothing stops. Overage is billed at the tier rate and appears on the next invoice, and we email you when you cross ninety per cent so it is never a surprise. We have never switched an account off for going over.

    What do we get back if we leave?

    Everything, in Parquet, for thirty days after the subscription ends — the raw events and the definition of every board and alert. Export is a button, not a support ticket.

    Logo Strip

    Content element

    Running in production at

    • Northbank
    • Alto Freight
    • Verity Health
    • Ostara
    • Fieldmark

    People

    Content element

    Programme

    Content element

    The programme

    What happens, in order.

    1. 09:30

      Opening

      Considered details

      Illustrative content for this element. Replace the words and images to suit your project.

    2. 09:30

      Opening

      A clear structure

      Illustrative content for this element. Replace the words and images to suit your project.

    3. 09:30

      Opening

      Room to make it yours

      Illustrative content for this element. Replace the words and images to suit your project.

    Work

    Content element

    Selected work

    Three we are allowed to talk about.

    • Client

      What was done

      Illustrative content for this element. Replace the words and images to suit your project.

      Considered details Considered details

    • Client

      What was done

      Illustrative content for this element. Replace the words and images to suit your project.

      A clear structure A clear structure

    • Client

      What was done

      Illustrative content for this element. Replace the words and images to suit your project.

      Room to make it yours Room to make it yours

    Category Mosaic

    Commerce element

    This element is available, but this demo has no matching content to display yet.

    Image and Text

    Content element

    The essential collection

    Pieces designed for everyday wear rather than for a season. Cut from four fabrics we buy every year, in sizes that stay in stock.

    Explore the collection

    Image Strip

    Content element

    Follow us

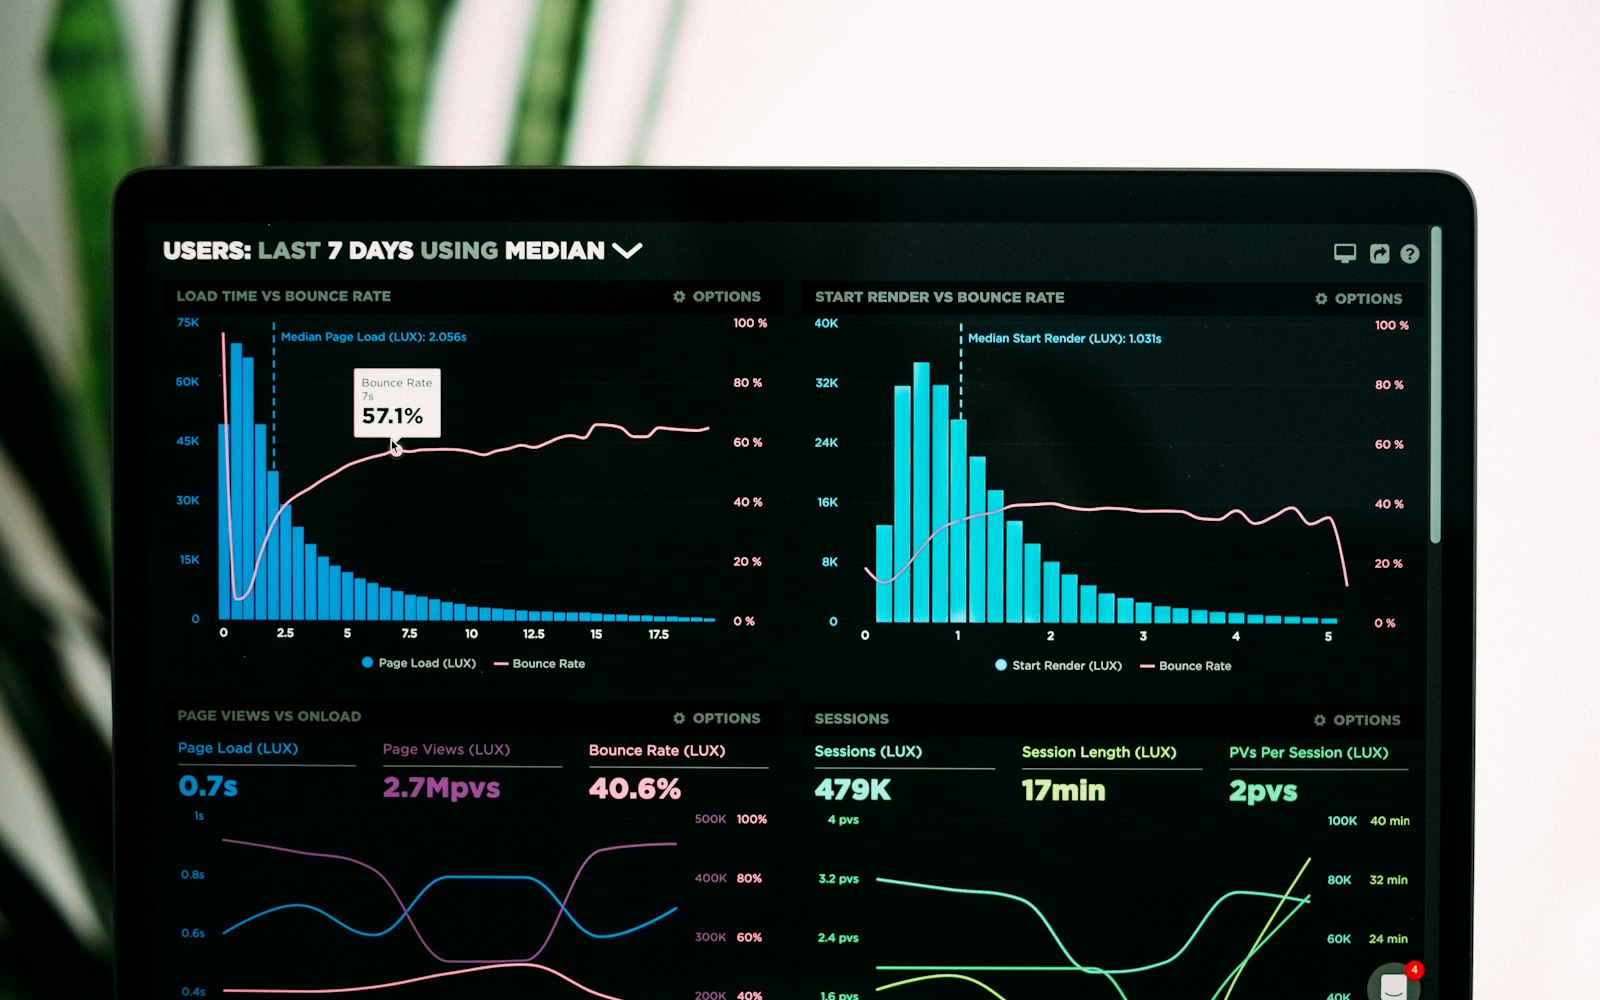
    An analytics board on a laptop screen: load time, bounce rate and sessions charted

    Signup Band

    Content element

    Deal of the day

    Commerce element

    This element is available, but this demo has no matching content to display yet.

    Shopping setups

    Commerce element

    This element is available, but this demo has no matching content to display yet.

    See it as a complete website.

    Explore the actual pages, navigation, product details and responsive layouts.

    Open Cadence Analytics ↗

    SOC 2 Type II · ISO 27001 · GDPR · Data residency in three regions · 99.9% measured availability

    Cart

    No products in the cart.